Last updated: 01-03-2022 12:53
Data Science Environment Sustainability
Highlight Data Vehicles Density and Microclimate 2021 in Bandung city
4 Urban Regions | 2 Suburban Regions
Visualization and Data Processing of Density Vehicles in Urban and Microclimate 2021
Do you Agree ? Help us improve data quality by filling out this form.
Home Traffic Microclimate Mobility and Transport Statistics and Predictions

Counting Car Process
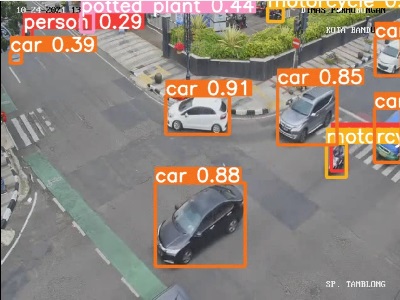
We carry out vehicle counting process automatically using YOLOv5 framework. YOLOV5 was a target detection algorithm based on regression. This algorithm has united many advantages of deep learning target detection framework. Yolov5 provides several models that can be used to perform object detection. In this project we use YOLOv5s as a model to carry out the vehicle detection process because of its superior speed in detecting vehicles. After going through data cleaning process, image data will be processed by YOLOv5. YOLOv5 will carry out vehicle detection process. The results of YOLOv5 process will be further processed using a python script to obtain the number of existing vehicles. This script will also export the results to a csv file.
From the results of performance tests, there are errors in the results of vehicle counting process. The biggest error occurs in number of motorcycle. This is because most of the vehicles, especially motorcycles, are jostled and blocked by other vehicles. In addition, there are also reading errors due to blurred image conditions and existing lighting conditions.
| No | Location | Street | Latitude | Longitude | ATCS Link |
|---|---|---|---|---|---|
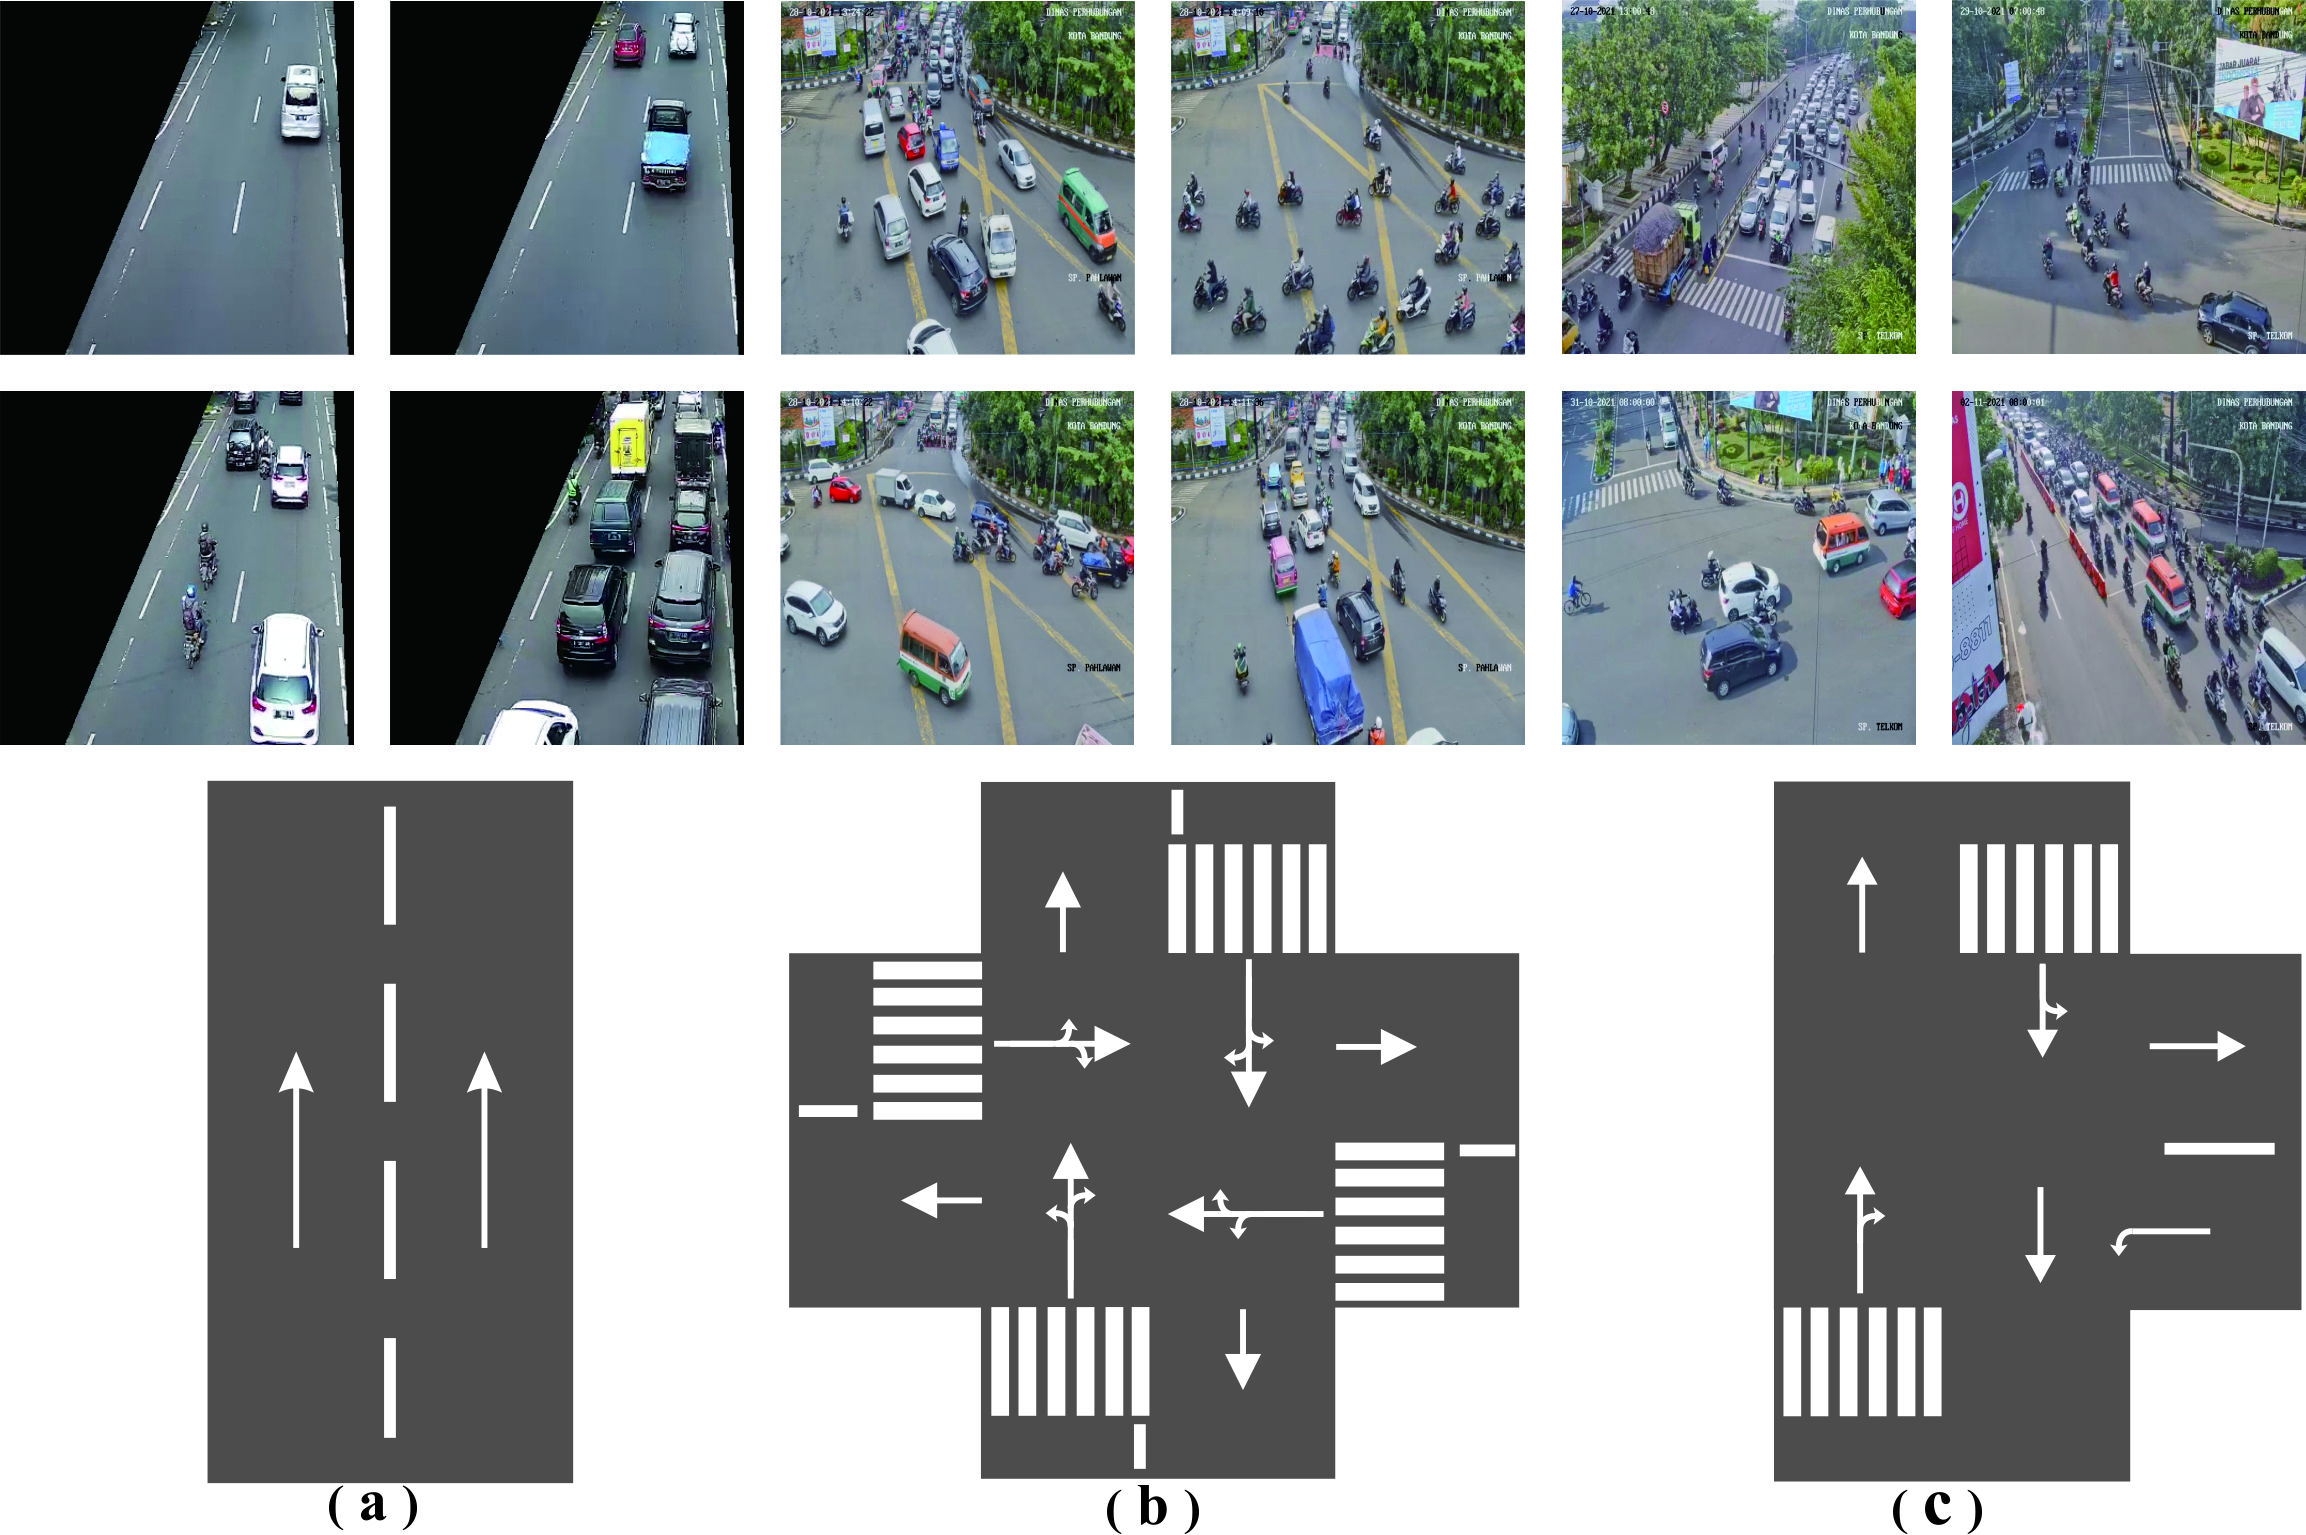
| 1 | Urban I | Ruas Otista | -6.920615 | 107.602744 | http://45.118.114.26/camera/Ruasotista.m3u8 |
| 2 | Urban III | Simpang Pahlawan | -6.897758 | 107.634188 | http://45.118.114.26/camera/Pahlawan.m3u8 |
| 3 | Urban IV | Simpang Telkom | -6.899292 | 107.619276 | http://45.118.114.26/camera/Telkom.m3u8 |

