Last updated: 01-03-2022 12:53
Data Science Environment Sustainability
Highlight Data Vehicles Density and Microclimate 2021 in Bandung city
4 Urban Regions | 2 Suburban Regions
Visualization and Data Processing of Density Vehicles in Urban and Microclimate 2021
Do you Agree ? Help us improve data quality by filling out this form.
Home Traffic Microclimate Mobility and Transport Statistics and Predictions

Traffic Congestion and Urban Heat Island (UHI)
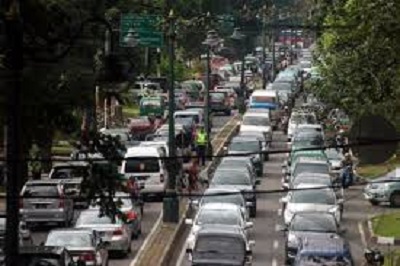
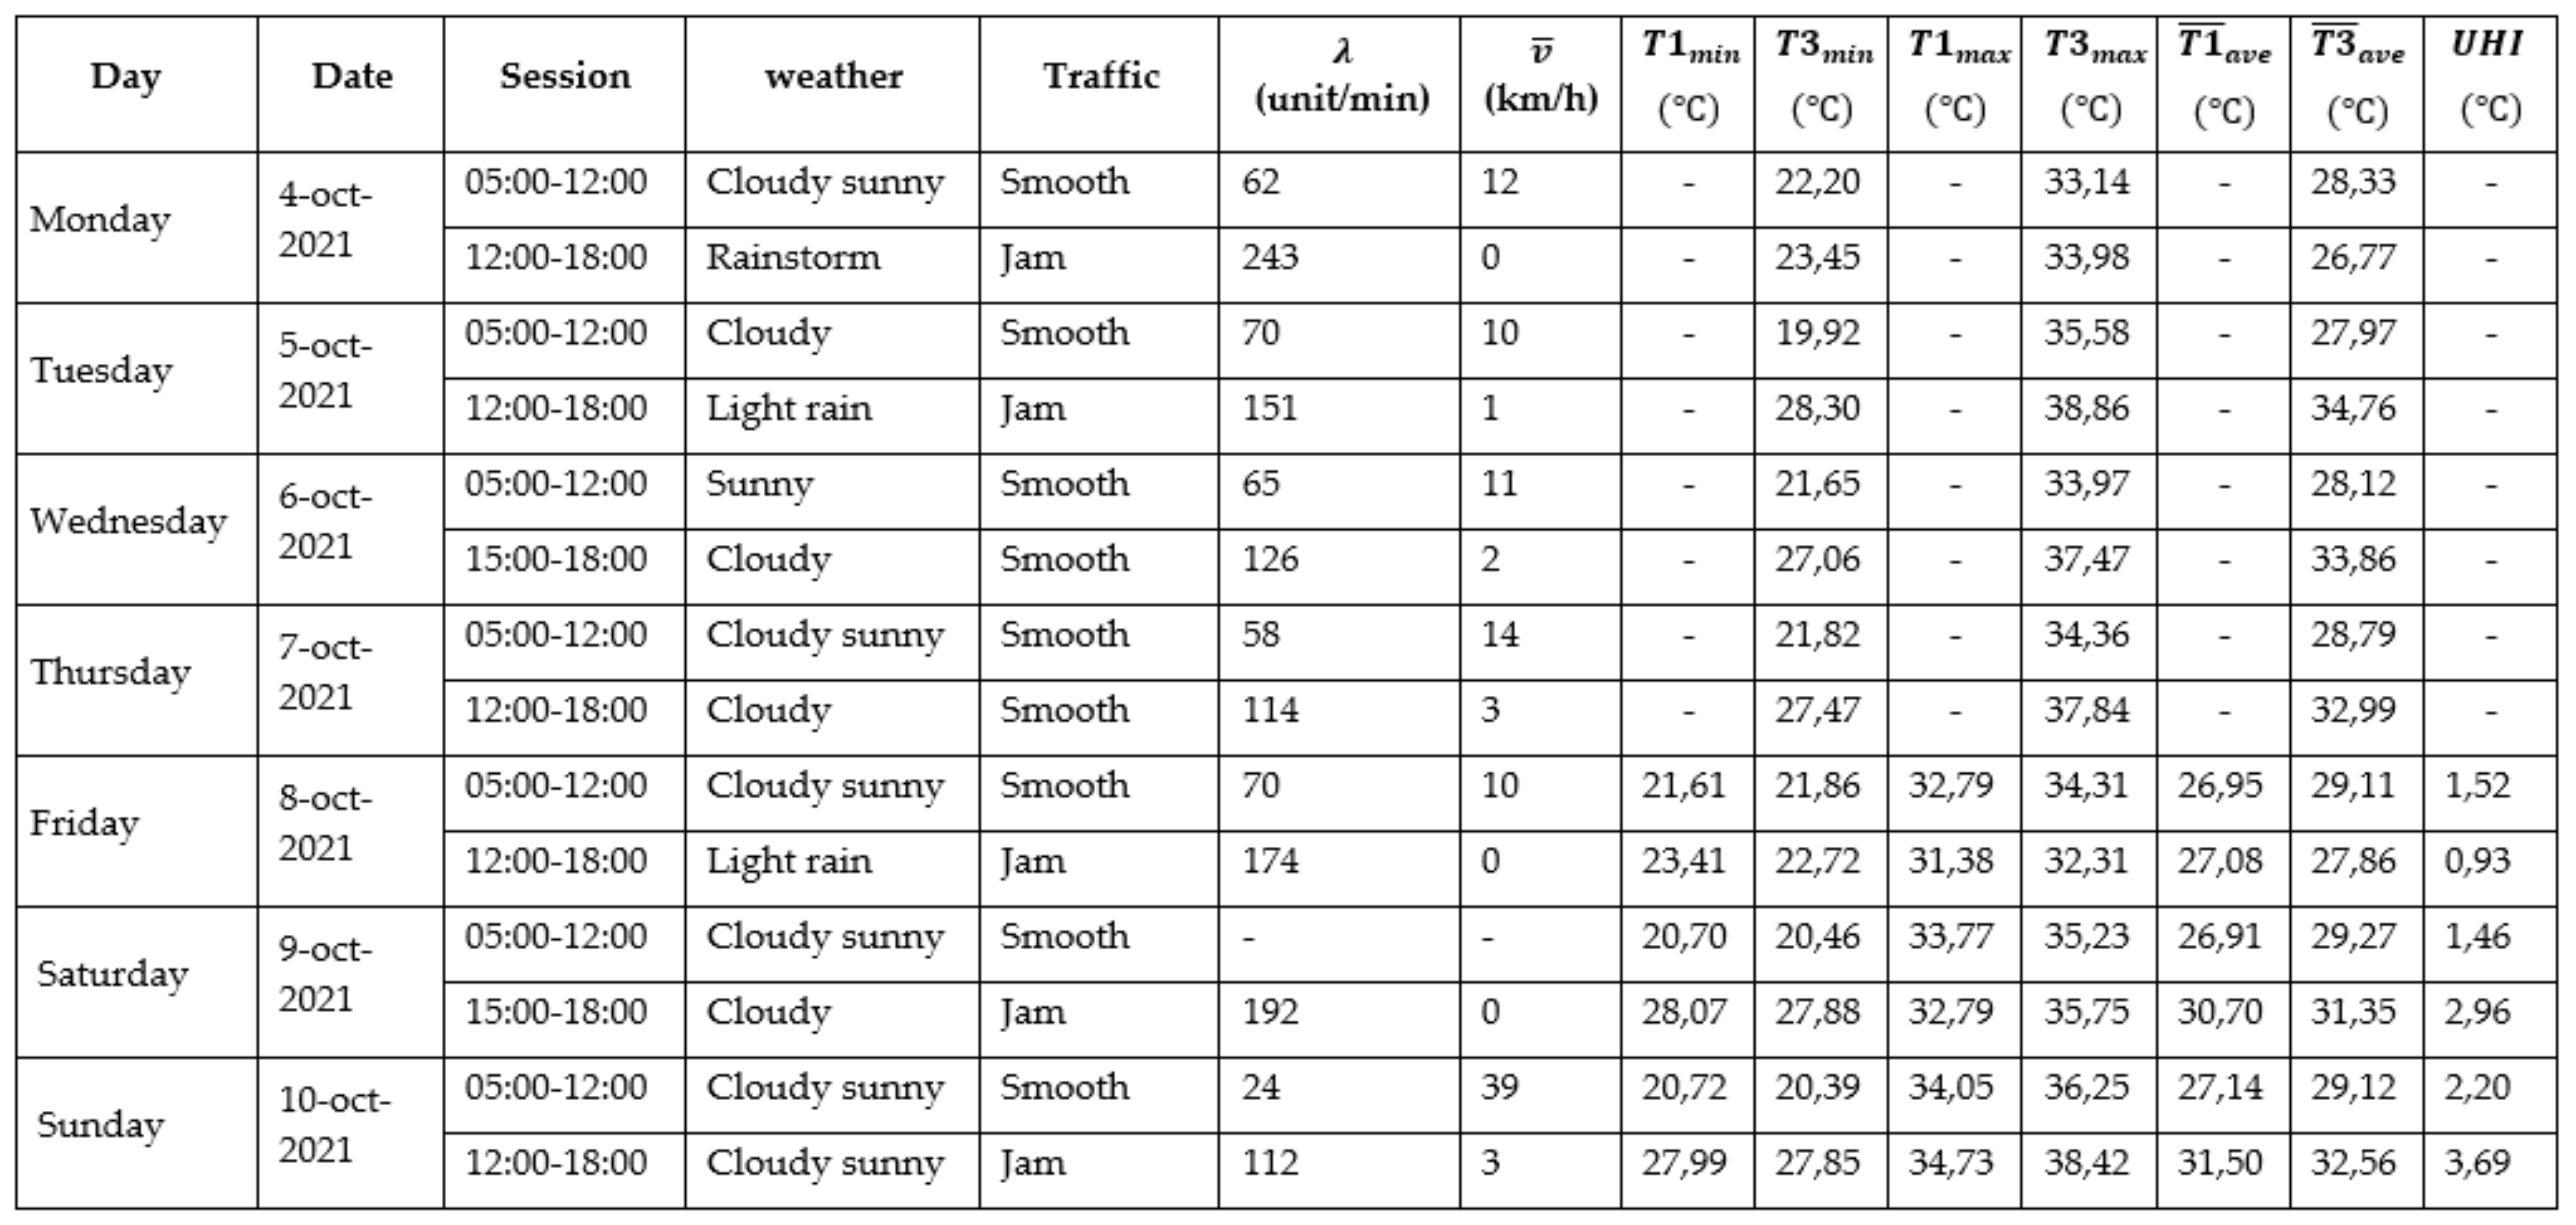
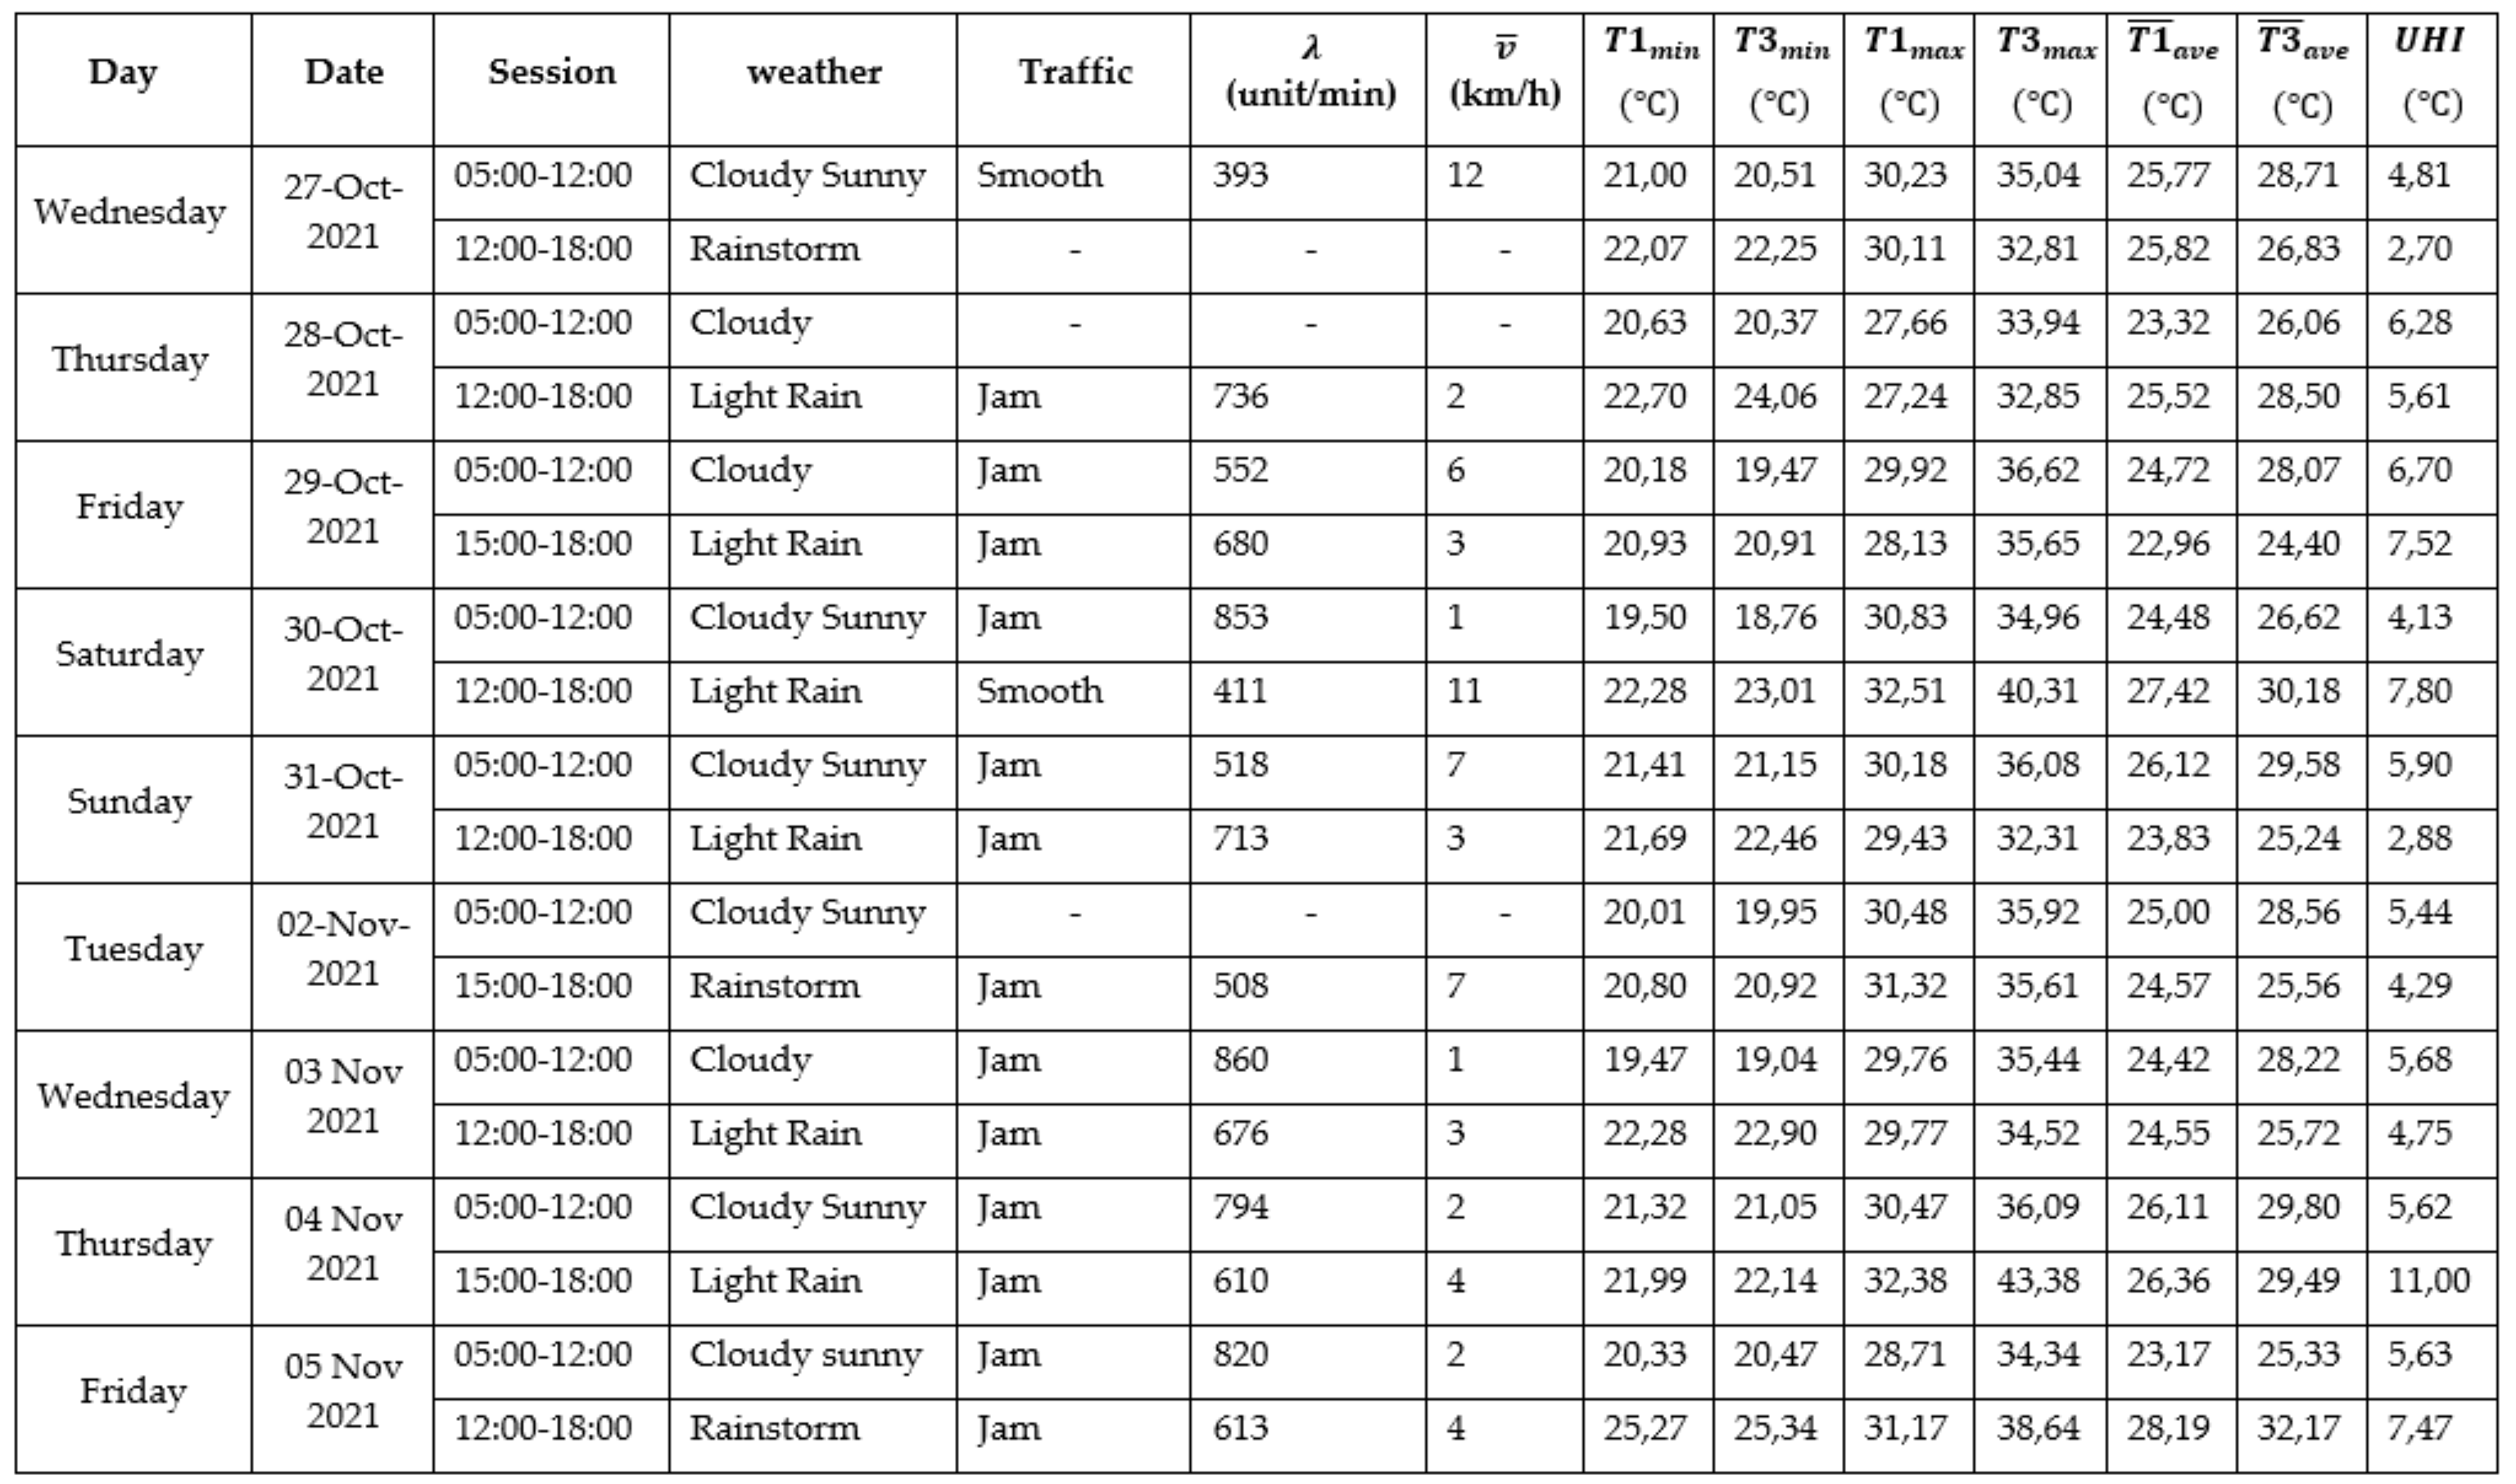
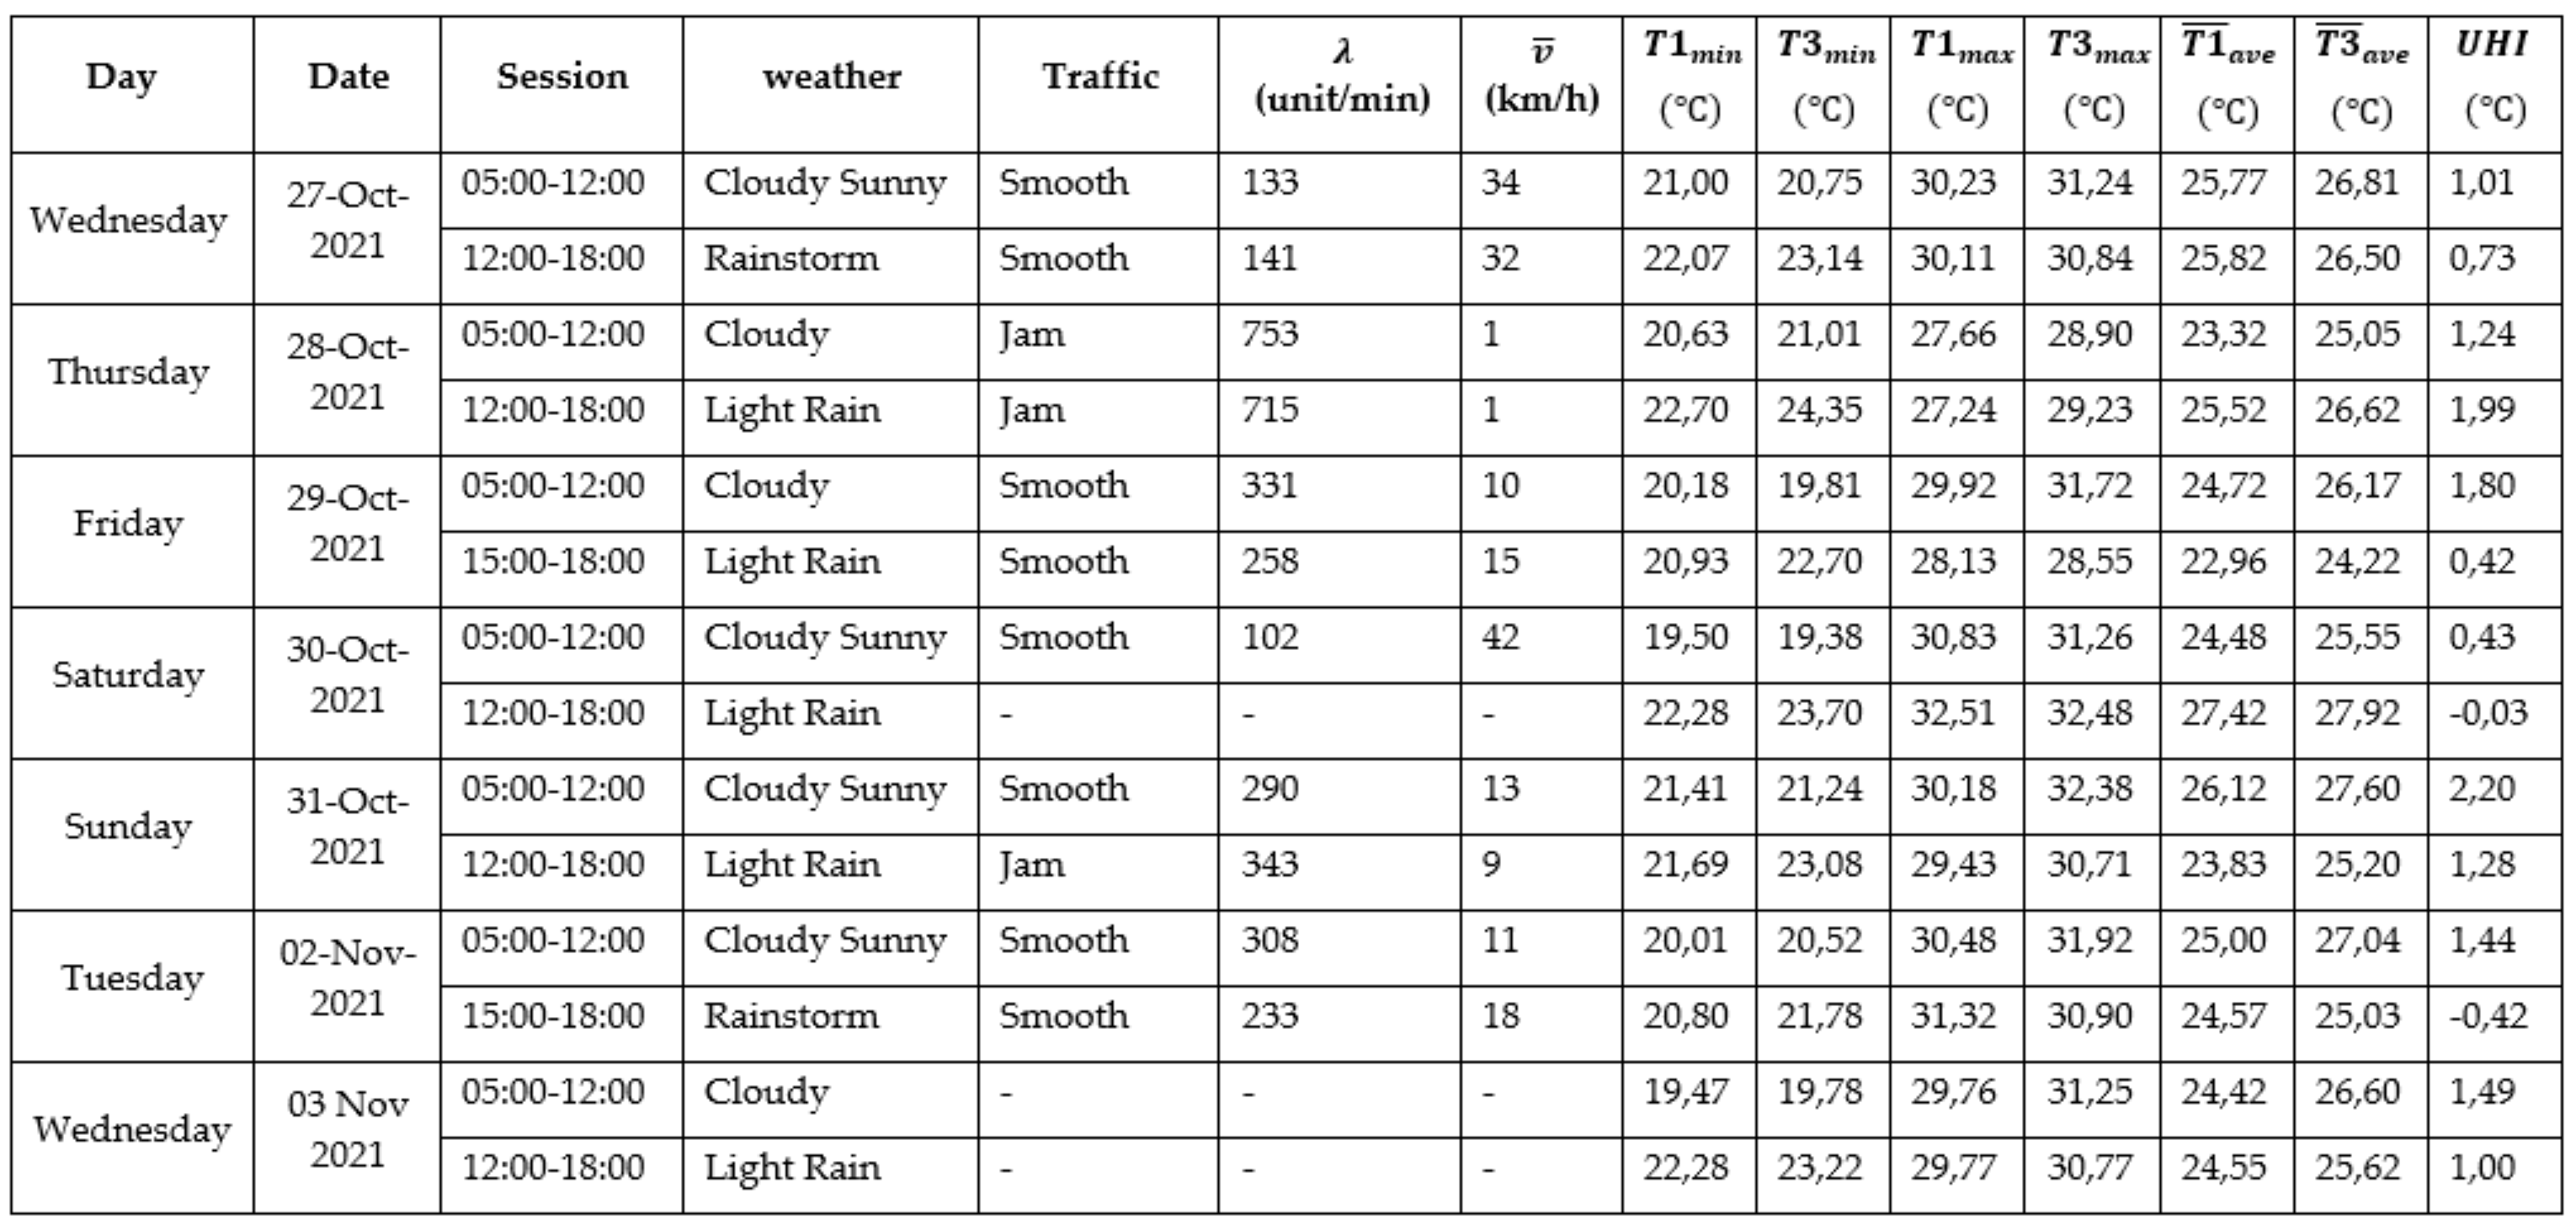
The result showed that the daily real time UHI temperature can reach 7 ℃ in the rush hour that caused traffic congested (See the Graph in Microclimate Section). Another fact is that if the weather is sunny, traffic jam occurs and UHI increase significantly. On the other hand, if the weather is rainy, the traffic jam and the UHI did not increase significantly (Table Below). The increase in temperature in the urban environment caused by traffic jams is directly proportional to the exhaust emissions produced. Based on the analysis using the correlation between UHI and traffic congestion, the correlation is quite large, with the value 0.64 with a scale of 1. The fixed station measurements provide the potential for better UHI observation because it can represent temperatures in the microclimate and provide a fine granularity in terms of time. It is expected to expand the implementation with a web application and utilize the data for predictive analytics using machine learning approaches.
INDEX TERMS Urban heat island (UHI); Urban Climate Alteration (UCA); traffic jam effect; queue rate model; fix station sensor


